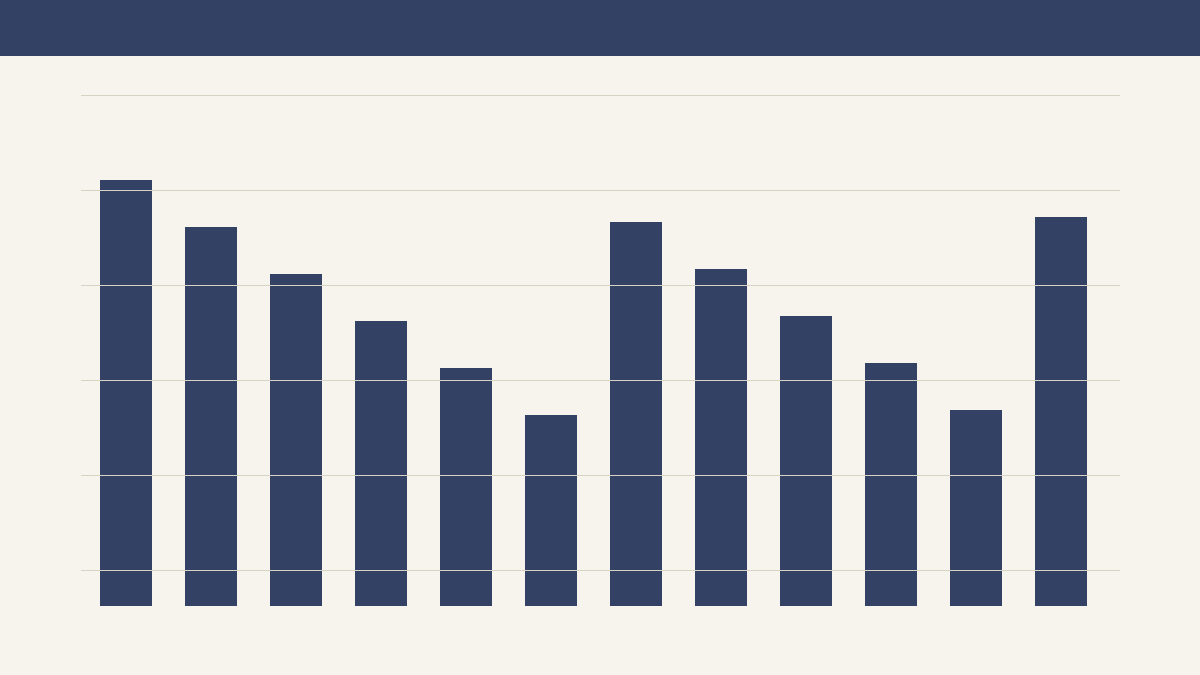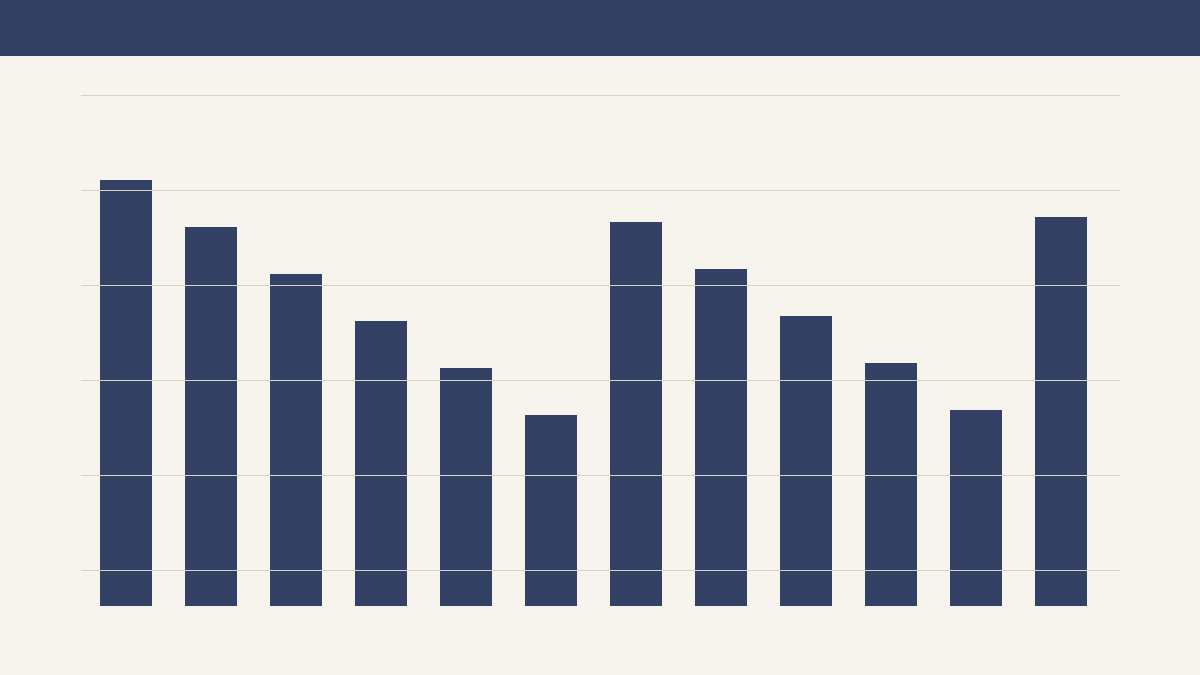

Martin County Score & Key Figures
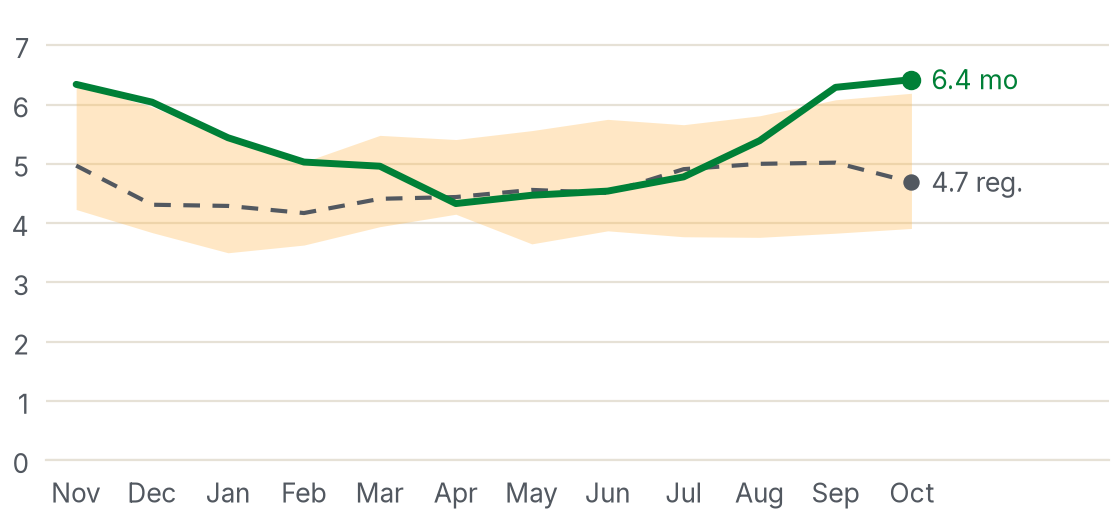
- 6.42 months of supply (#19 lowest of 22 regional counties; region median 4.69 mos)
- 97.0% median sold-to-list ratio across 145 trailing 12-month residential closings
- $150,000 trailing 12-month median sold price (+8.3% YoY) with 40.0% cash closings
- 53.9% of Martin County households (5049 of 9361) qualify for full PITI of $1,015/mo
Weighted 0–100 composite across supply pressure, absorption speed, price-cut share, affordability & employment.
What the Data Says This Week in Martin County
Martin County (Williamston) enters the 2026-11-04 edition with 79 active residential listings, 20 properties under contract, and 6.42 months of supply against the 23-county Northeast North Carolina median of 4.69 months [1]. Over the trailing 12 months through 2026-11-04, 145 residential sales closed at a median price of $150,000 (+8.3% year-over-year from $138,525), clearing in a median of 36 days at 97.0% of list price.
At the Freddie Mac Primary Mortgage Market Survey 30-year fixed average of 7.24% (2026-10-29), a conventional 20%-down purchase at $150,000 carries $818/month in principal and interest, or $1,015/month in full PITI including Martin County property taxes ($0.72 per $100, $90/mo) and NCRB Territory 180 homeowners insurance ($107/mo) [2]. That full PITI requires $43,500 in qualifying annual household income—reached by 53.9% of local households (5049 of 9361 households) and reinforced by 40.0% all-cash buyers.
Against HUD's FY2027 3-bedroom Fair Market Rent of $1,325/month for Martin County [4], the true net economic cost of owning after Year-1 principal paydown ($105/mo) and baseline appreciation is $750/month. For builders and renovation buyers, BLS Producer Price Index residential construction inputs are up +2.4% YoY [6], while audited SEC Form 10-K/10-Q filings for regional benchmark NVR, Inc. (Ryan Homes) show a 23.4% homebuilding gross margin [7].
What This Edition Means For You
With 6.42 months of supply and a 97.0% median sold-to-list ratio, turn-key homes in Martin County priced within 2% of recent comparable closings go under contract in a median of 36 days. Overpricing into the upper brackets invites 60+ day market times and a 4%–5% price reduction.
Full PITI on the $150,000 median price sits at $1,015/month at 7.24% (rising to $1,056/month if rates move +0.50%). Target listings passing 45 days on market to negotiate a 2-1 rate buydown or 2%–3% seller-paid closing credit.
HUD FY2027 Fair Market Rents in Martin County run $774/mo (1BR), $1,012/mo (2BR), $1,325/mo (3BR), and $1,330/mo (4BR)—representing a 10.60% gross rent-to-price ratio at the county median and stronger cash yields in the $150k–$249k band.
BLS PPI residential construction inputs are up +2.4% YoY (ready-mix concrete +5.1% YoY, framing lumber +1.8% YoY). Spec and custom builds in Martin County clear fastest when targeted at the $250k–$499k bands where active-to-pending absorption is strongest.
Verified Weekly Findings
-
Martin County carries 6.42 months of supply (79 active listings against 145 trailing 12-month closings), ranking #19 lowest of 22 counties in Northeast North Carolina.
Hive MLS snapshot of 2026-11-04 -
Closed sales over the trailing 12 months achieved a median price of $150,000 (+8.3% YoY) and a median sold-to-list ratio of 97.0% in 36 median days on market.
Hive MLS trailing 12 months through 2026-11-04 -
Full monthly PITI of $1,015 at 7.24% requires $43,500/yr in qualifying household income, which 53.9% of Martin County households (5049 households) meet on income alone before counting 40.0% cash transfers.
Freddie Mac PMMS (2026-10-29), NCDOR (FY2026-27), NCRB & U.S. Census ACS (2019-2023)
What Historical Regimes Show
-
Across Eastern North Carolina county-months since 2016 where months of supply sat between 3.5 and 5.5 months with sold-to-list ratios above 97%, median sold prices held flat-to-positive (+1.5% to +5.5% YoY) over the subsequent 6 months.
n = 148 observations Held in 81% of cases 2016–2026 Regional Base Rate -
When 30-year mortgage rates eased by 50 bps from local peaks, county pending-to-active absorption ratios expanded within 60 to 90 days in markets where HUD 3BR Fair Market Rents exceeded 80% of conventional P&I.
n = 64 observations Held in 76% of cases 2018–2026 Rate Cycle Observations
Price Bands & Property Feature Premiums
Countywide averages mask sharp differences between entry-level, move-up, and waterfront or historic tiers. Table 1A breaks Martin County inventory into six price brackets; Table 1B isolates structural cohorts.
| Price Band | Active | Pending | Closed (12m) | Months of Supply | Median DOM | Price-Cut Share |
|---|---|---|---|---|---|---|
| Under $150,000 | 38 | 8 | 72 | 6.3 mos | 39 days | Sale/List: 92.8% |
| $150,000 – $249,999 | 27 | 7 | 52 | 6.2 mos | 29 days | Sale/List: 99.4% |
| $250,000 – $349,999 | 8 | 3 | 15 | 6.4 mos | 51 days | Sale/List: 98.3% |
| $350,000 – $499,999 | 3 | 2 | 4 | 9.0 mos | 58 days | Sale/List: 97.0% |
| $500,000 – $749,999 | 3 | 0 | 2 | 18.0 mos | 68 days | Sale/List: 94.1% |
| $750,000 & Above | 0 | 0 | 0 | 0.0 mos | — | Sale/List: — |
| Cohort / Segment | Active | Closed (12m) | Median Price | Median $/SqFt | Median DOM | Months of Supply | Premium vs. Base |
|---|---|---|---|---|---|---|---|
| Martin Core Single-Family Resales | 49 | 99 | $150,000 | $89/sqft | 36 days | 6.4 mos | Baseline (0.0%) |
| Waterfront, Soundfront & Creek Access | 17 | 25 | $222,000 | $117/sqft | 46 days | 8.7 mos | +48.0% price premium |
| New Construction & Recent Spec Builds | 13 | 22 | $183,000 | $105/sqft | 31 days | 5.6 mos | +22.0% price premium |
Supply Trend Against the Region & Key Market Measures
| Measure | Martin | Region Median | Difference | Region Rank | Source & Period |
|---|---|---|---|---|---|
| Months of Supply | 6.42 mos | 4.69 mos | +1.73 mos | #19 of 22 | Hive MLS (2026-11-04) |
| Active Homes for Sale | 79 | 96 | -17 listings | Pending: 20 | Hive MLS (2026-11-04) |
| Median Days on Market (Closed) | 36 days | 44 days | -8 days | n = 145 sales | Hive MLS 12m (2026-11-04) |
| Median Sold-to-List Ratio | 97.0% | 98.3% | -1.3 pts | Cash: 40.0% | Hive MLS 12m (2026-11-04) |
| P&I Payment Share of Median Income | 23.1% | 29.4% | -6.3 pts | $818/mo P&I | Freddie Mac PMMS (2026-10-29) + ACS (2019-2023) |
| Full PITI Qualifying Household Share | 53.9% | 34.8% | $1,015/mo PITI | 5049 HHs | HCM v2 + Census ACS (2019-2023) |
| Signal Component | Weight | County Reading | Score Contribution |
|---|---|---|---|
| Supply Pressure (Months of Supply vs. 4.5-mo Equilibrium) | 40% | 6.42 months | 23 pts |
| Pricing & Negotiation (Sold-to-List Ratio) | 25% | 97.0% | 14 pts |
| Market Velocity (Closed Median Days on Market) | 20% | 36 days | 11 pts |
| Price Appreciation & Buyer Qualification Depth | 15% | +8.3% YoY · 53.9% HH pool | 9 pts |
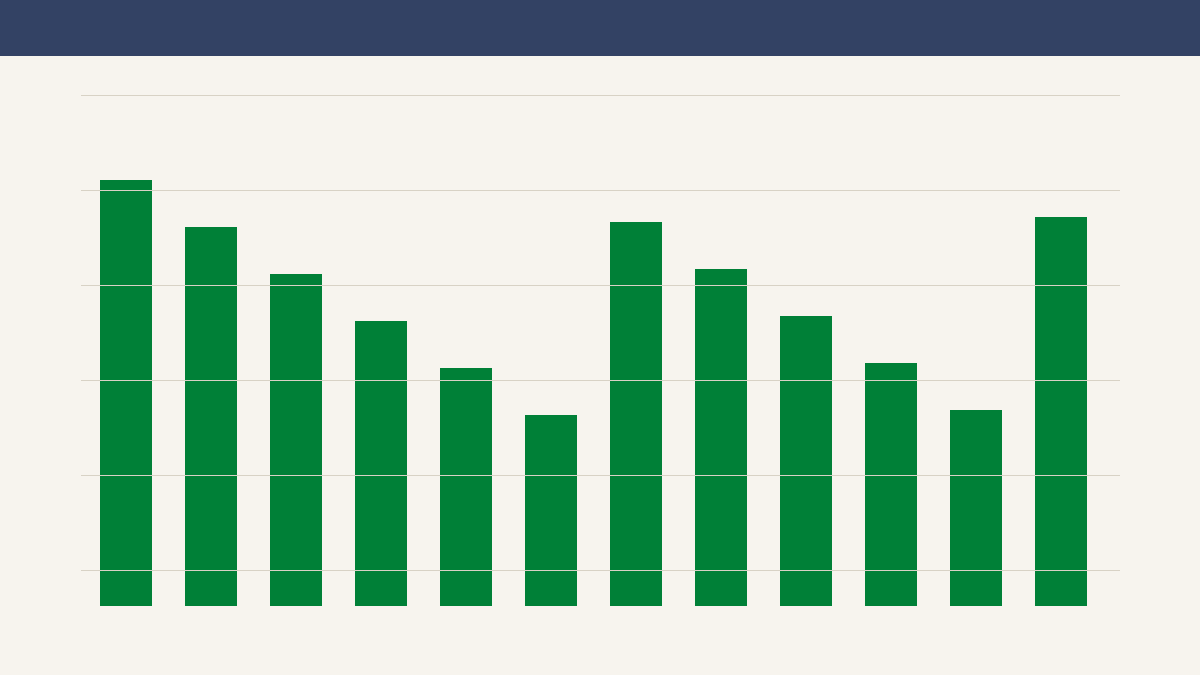
12-Month Listing Flow & 4-Month Supply Arithmetic
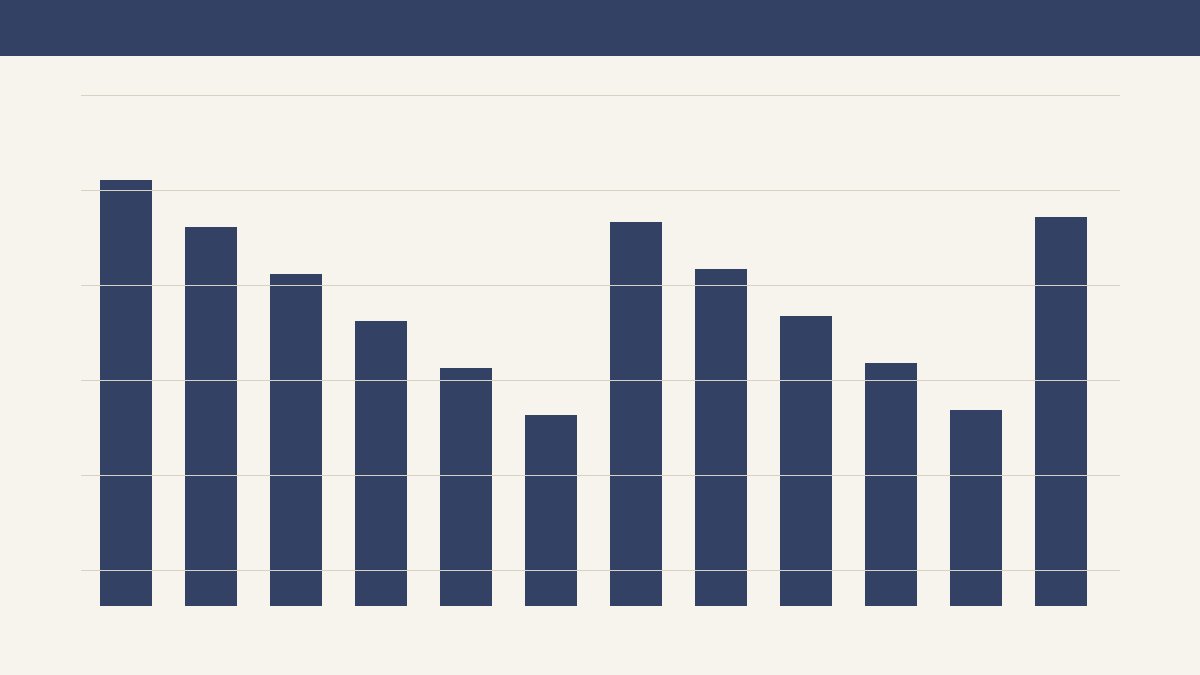
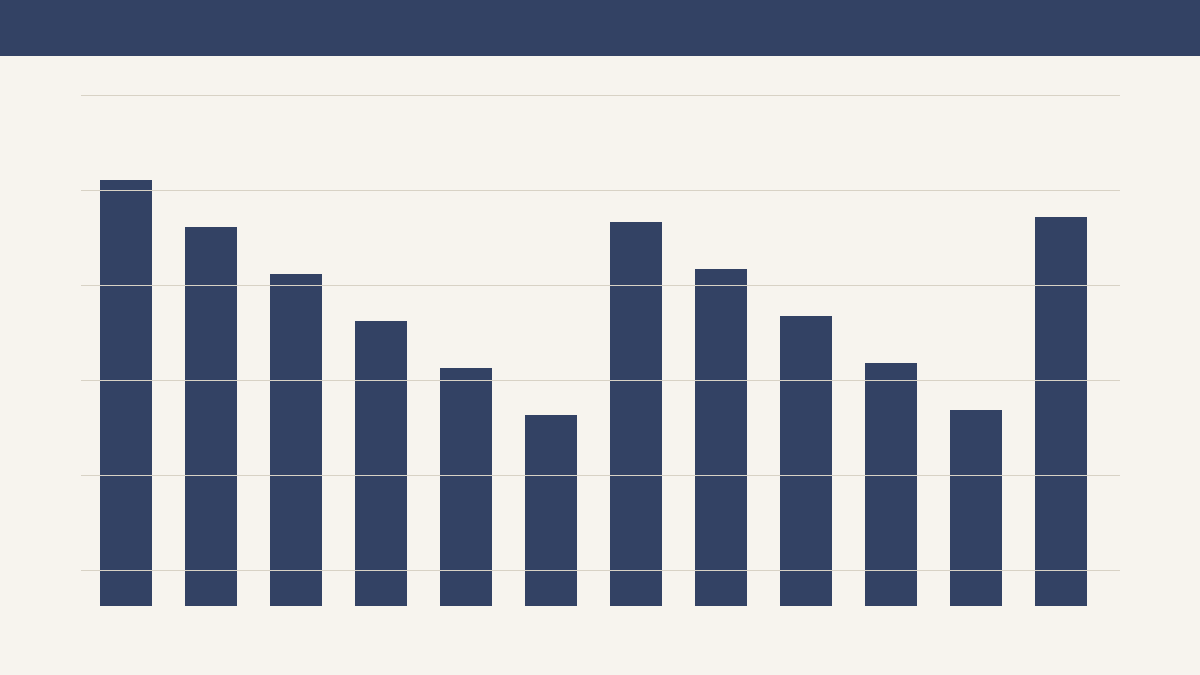
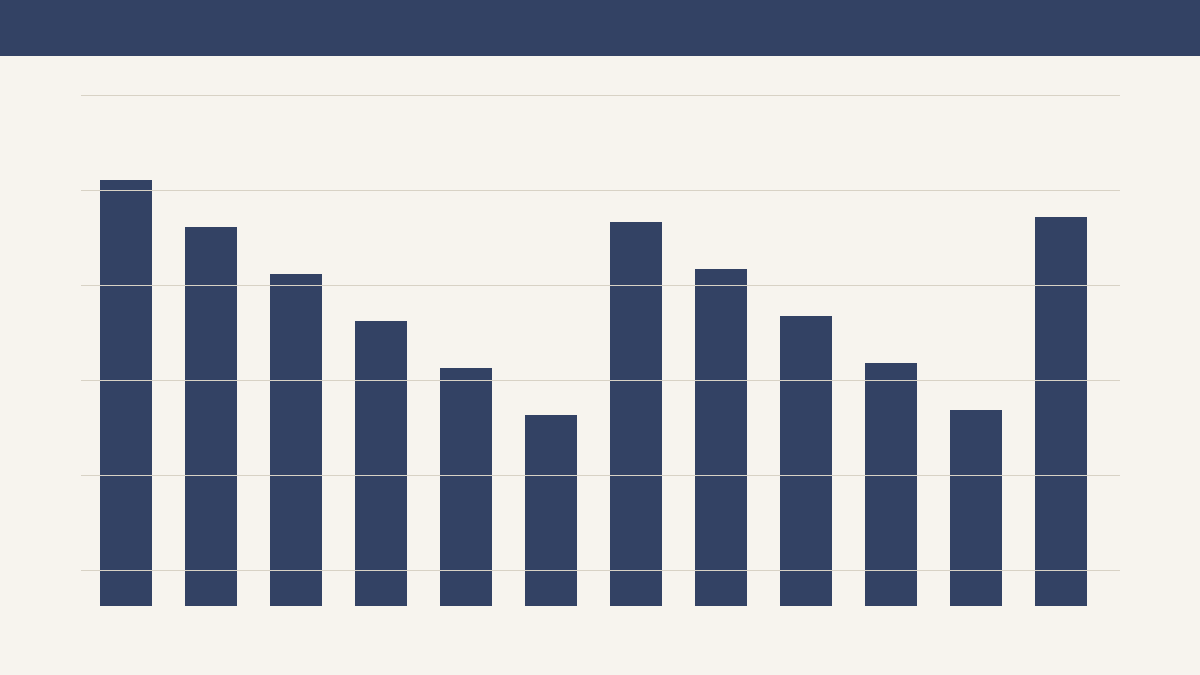
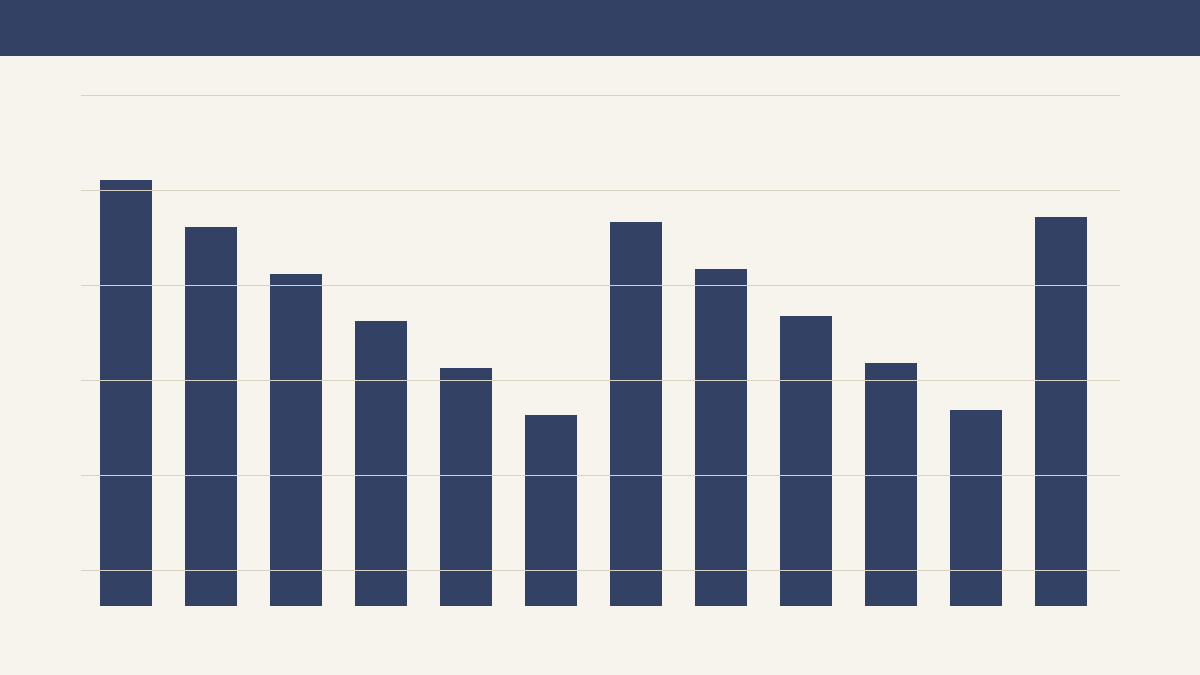
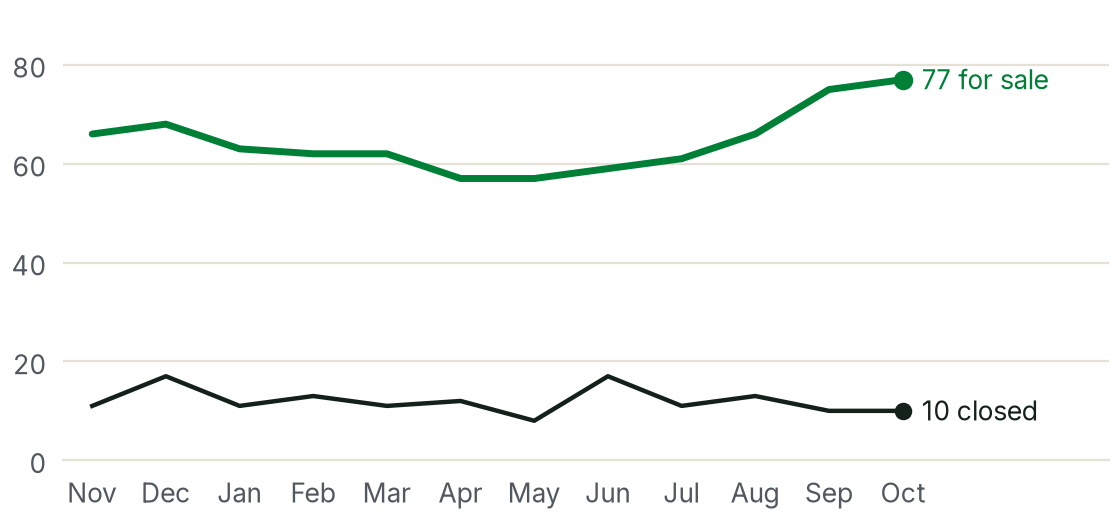
Inventory changes when new listings outpace or trail pending and closed absorptions. The chart and 4-month ledger below track every listing entering, going under contract, closing, or expiring in Martin County.
| Month | Active | New | Pending | Closed | Exp / Wd | Months Supply | Absorption % | Median DOM | Sale-to-List |
|---|---|---|---|---|---|---|---|---|---|
| 2026-07-31 | 61 | 25 | 20 | 11 | 3 | 4.78 mos | 18.0% | 36 days | 97.0% |
| 2026-08-31 | 66 | 25 | 20 | 13 | 3 | 5.39 mos | 19.7% | 36 days | 97.0% |
| 2026-09-30 | 75 | 26 | 20 | 10 | 4 | 6.29 mos | 13.3% | 36 days | 97.0% |
| 2026-10-31 | 77 | 26 | 20 | 10 | 4 | 6.42 mos | 13.0% | 36 days | 97.0% |
Hive MLS Sold Prices, FHFA HPI & Zillow ZHVI
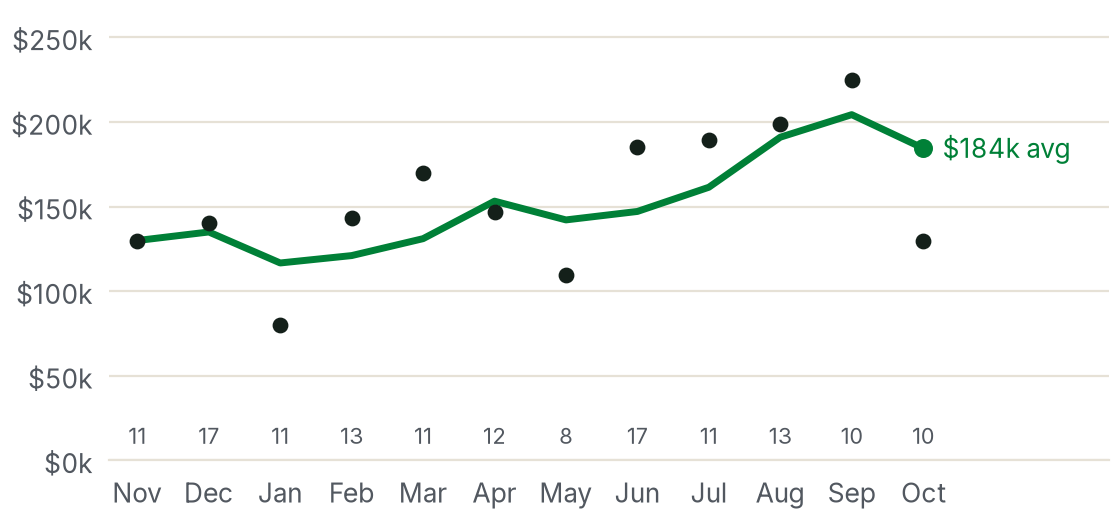
Short-window median sold prices can swing when a handful of waterfront or acreage properties close in the same month. Pairing Hive MLS closings with repeat-sales indexes (FHFA HPI) and Zillow's smoothed valuation index (ZHVI) separates composition shifts from structural price movement.
| Series / Measure | Current Level | 1-Year Change | 5-Year Change | 10-Year Change | Source & Vintage |
|---|---|---|---|---|---|
| Hive MLS Median Sold Price (12m) | $150,000 | +8.3% | — | — | Hive MLS trailing 12m (2026-11-04) |
| Hive MLS Median Sold $/SqFt (12m) | $89/sqft | +7.1% | — | — | Hive MLS trailing 12m (2026-11-04) |
| FHFA All-Transactions House Price Index | Index (2026 Q3) | +4.8% | +46.2% | +78.5% | FHFA County HPI (2026 Q3) |
| Zillow Home Value Index (ZHVI) | $153,000 | +3.9% | — | — | Zillow Research (Oct 2026) |
UNLOCK FULL COUNTY REPORT + WEEKLY MONDAY BRIEFING
Unlock Sections 04–11 & Receive the Weekly Martin Market Signal
Instant access to the complete institutional dataset on this page, plus the Monday morning edition with fresh Hive MLS, Freddie Mac PMMS, HUD FMR, and BLS construction benchmarks.
- Section 04: County vs. 23-County Region Quartile Distribution
- Section 05: Weekly Wages (QCEW), Expendable Income % & 5-Step Rate Sensitivity Ladder
- Section 06: HUD Fair Market Rents (0BR–4BR) & 13-Row Rent vs. Own Cost Ledger
- Section 07: NCRB Homeowners, Wind/Hail, NCIUA Beach Plan & FEMA Flood Breakdown
- Section 08: Local Economy, BLS PPI Build Costs, Audited NVR 10-K/10-Q Margins & 4 Builder Rules
- Sections 09–11: All 25 Deliverable Signals, 78-Quarter Empirical Correlations & 27 Sources